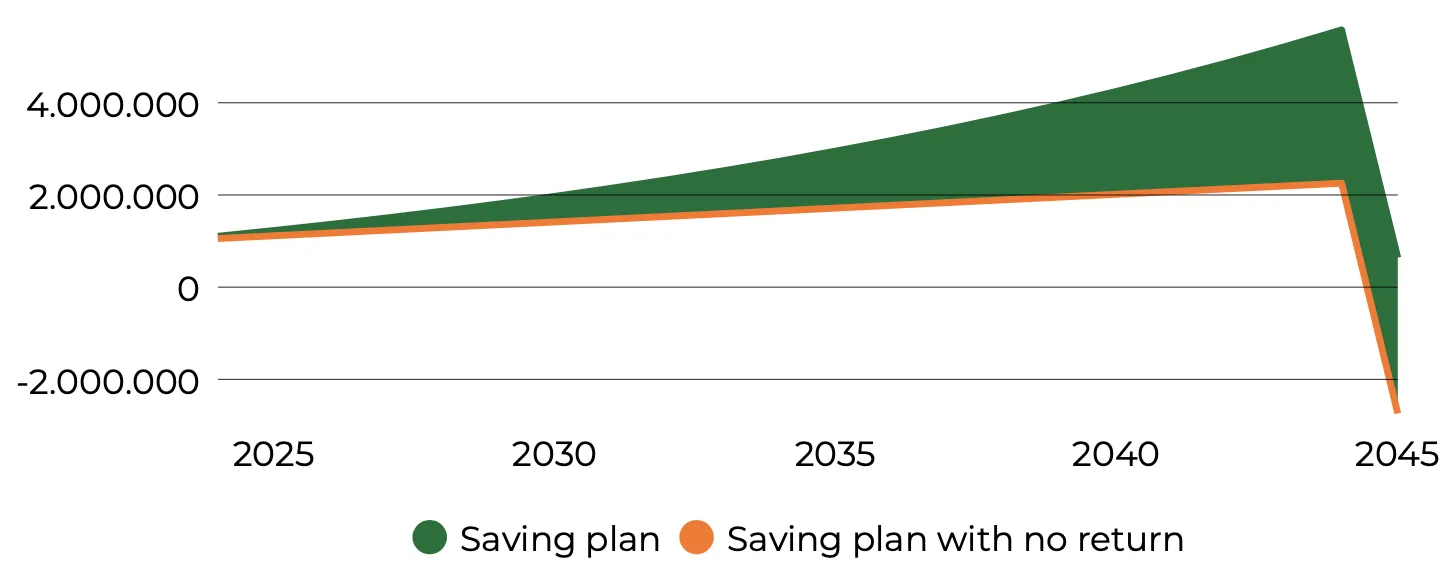
Basic charts
The basic charts in our Investment Proposal Engine are crafted to effectively visualize key data in an intuitive and accessible format. These charts are essential for presenting standard financial information, such as performance metrics, asset allocation, or risk profiles. Their straightforward design ensures that complex data is transformed into clear, easy-to-understand visuals. In this section, you will find a comprehensive showcase of all the chart types available in our Engine. Each chart is designed to meet different data representation needs, ensuring that you can choose the most suitable type for your specific context.
Allocation charts
The allocation charts serves the purpose of presenting the investor with information regarding the allocation of the portfolio. These charts can be either a pie-chart or a doughnut-chart.
Broad asset allocation
Visualise the asset allocation on main asset class level
With legends:
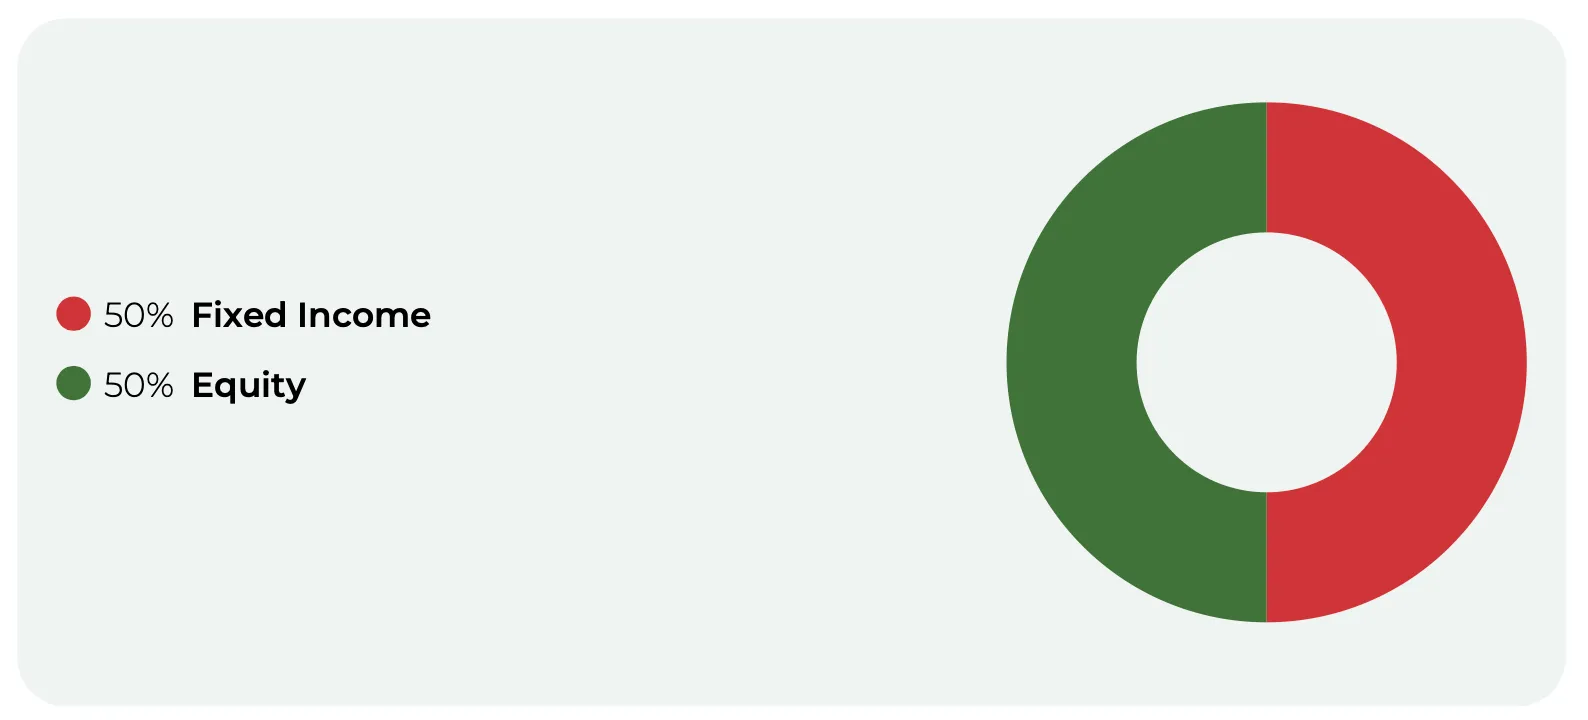
Without legends:

Asset allocation
Visualise the asset allocation on sub asset class level
With legends:
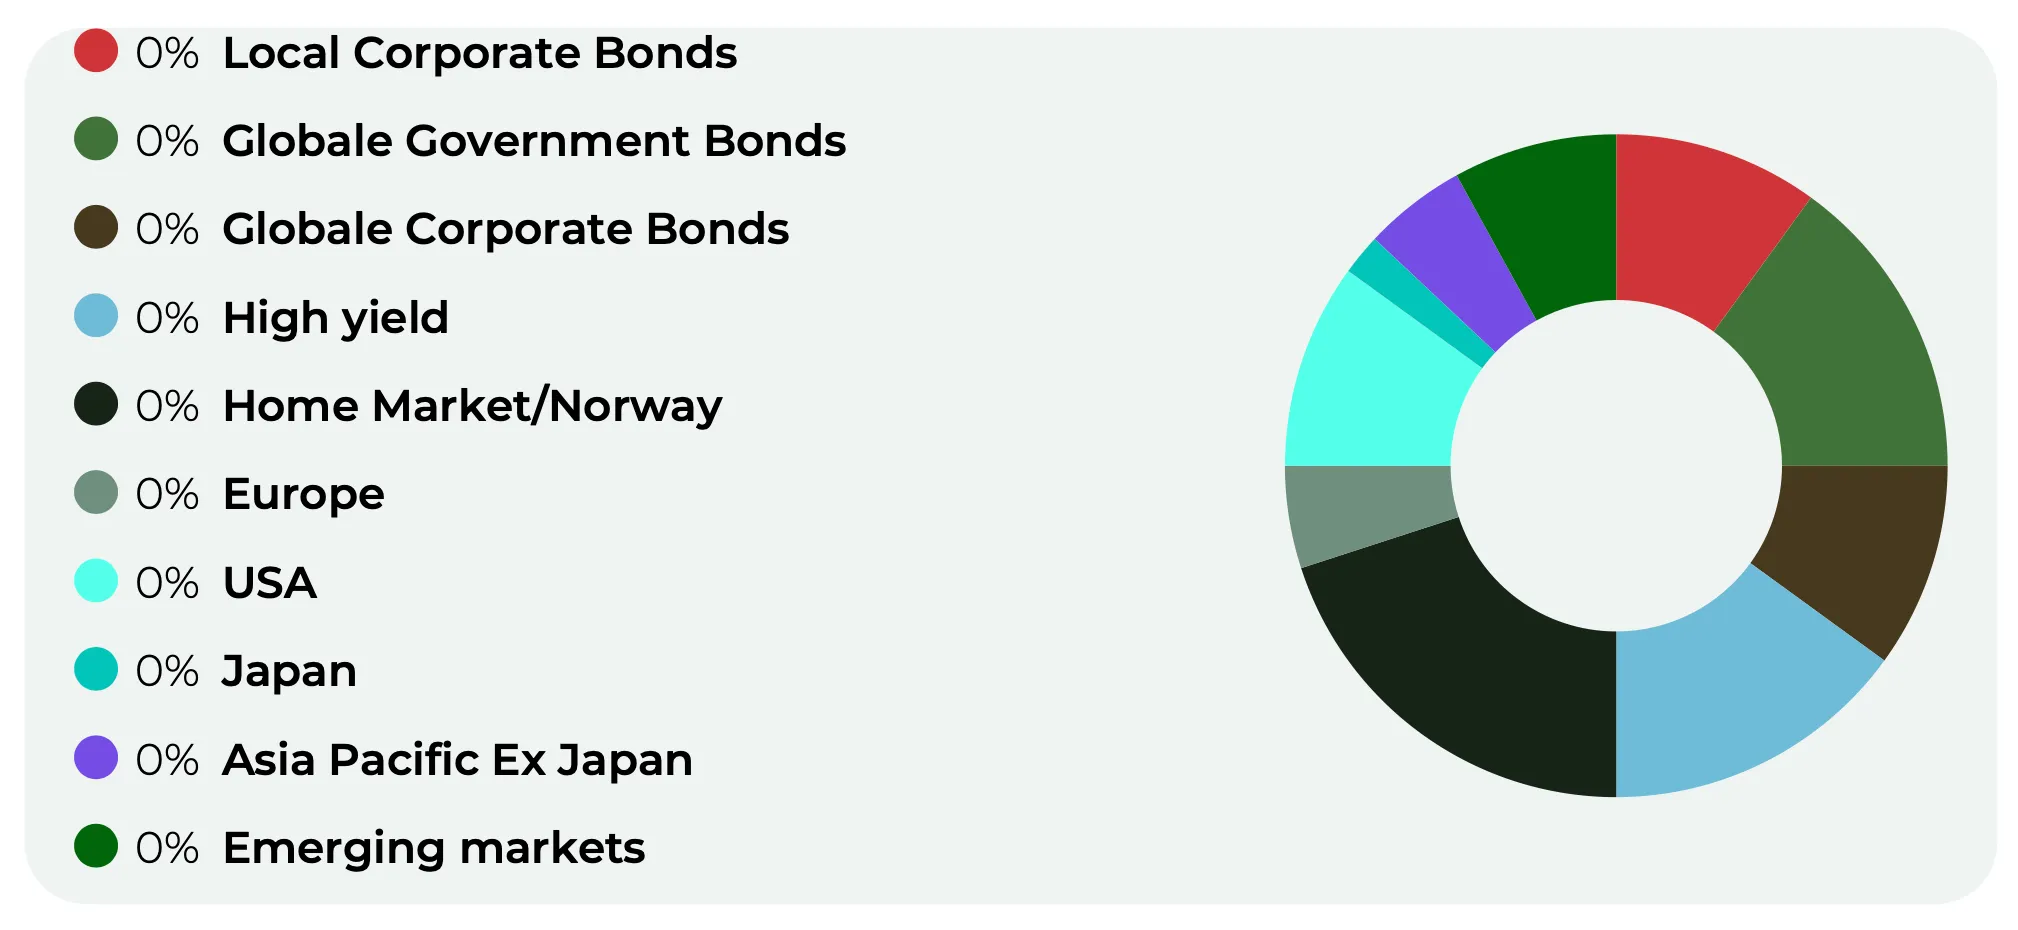
Without legends:
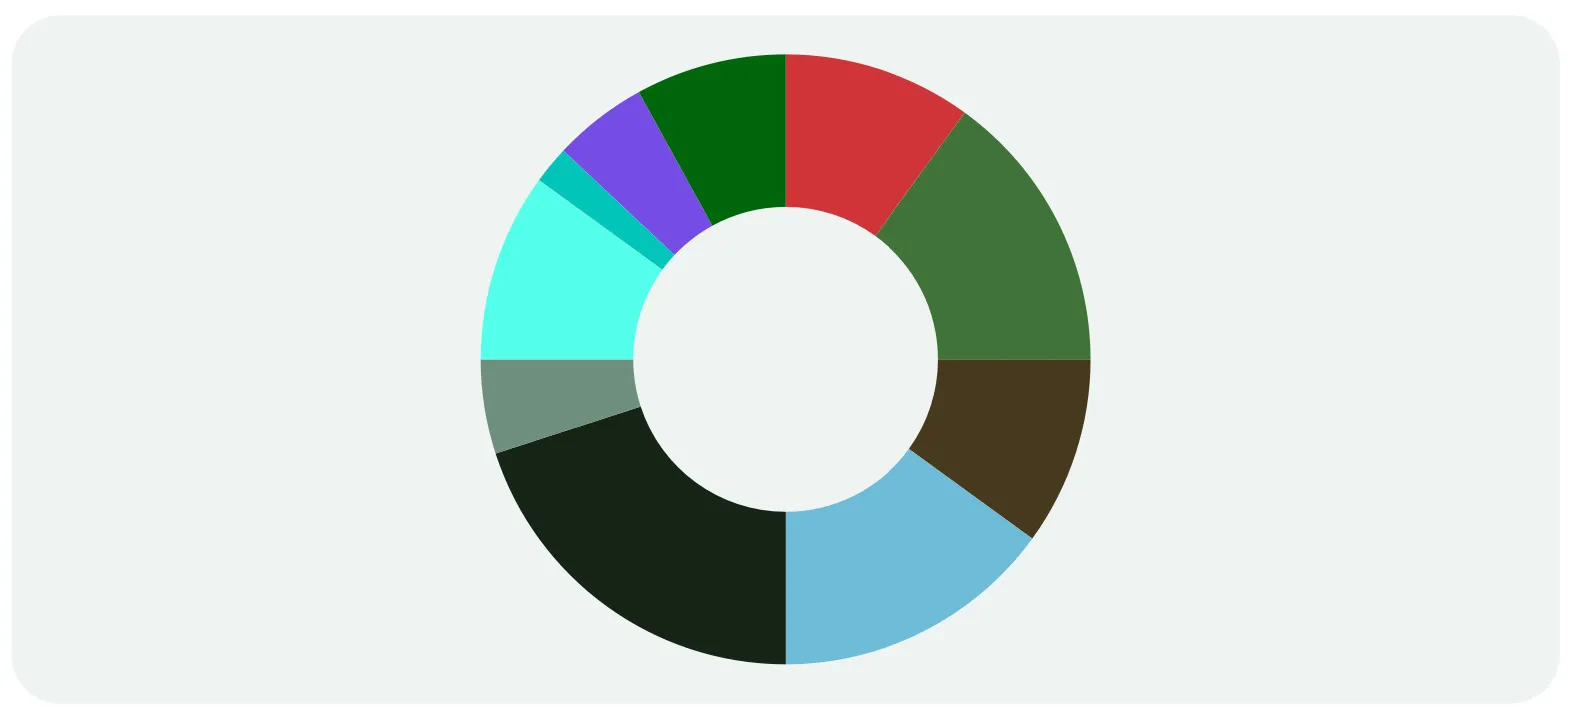
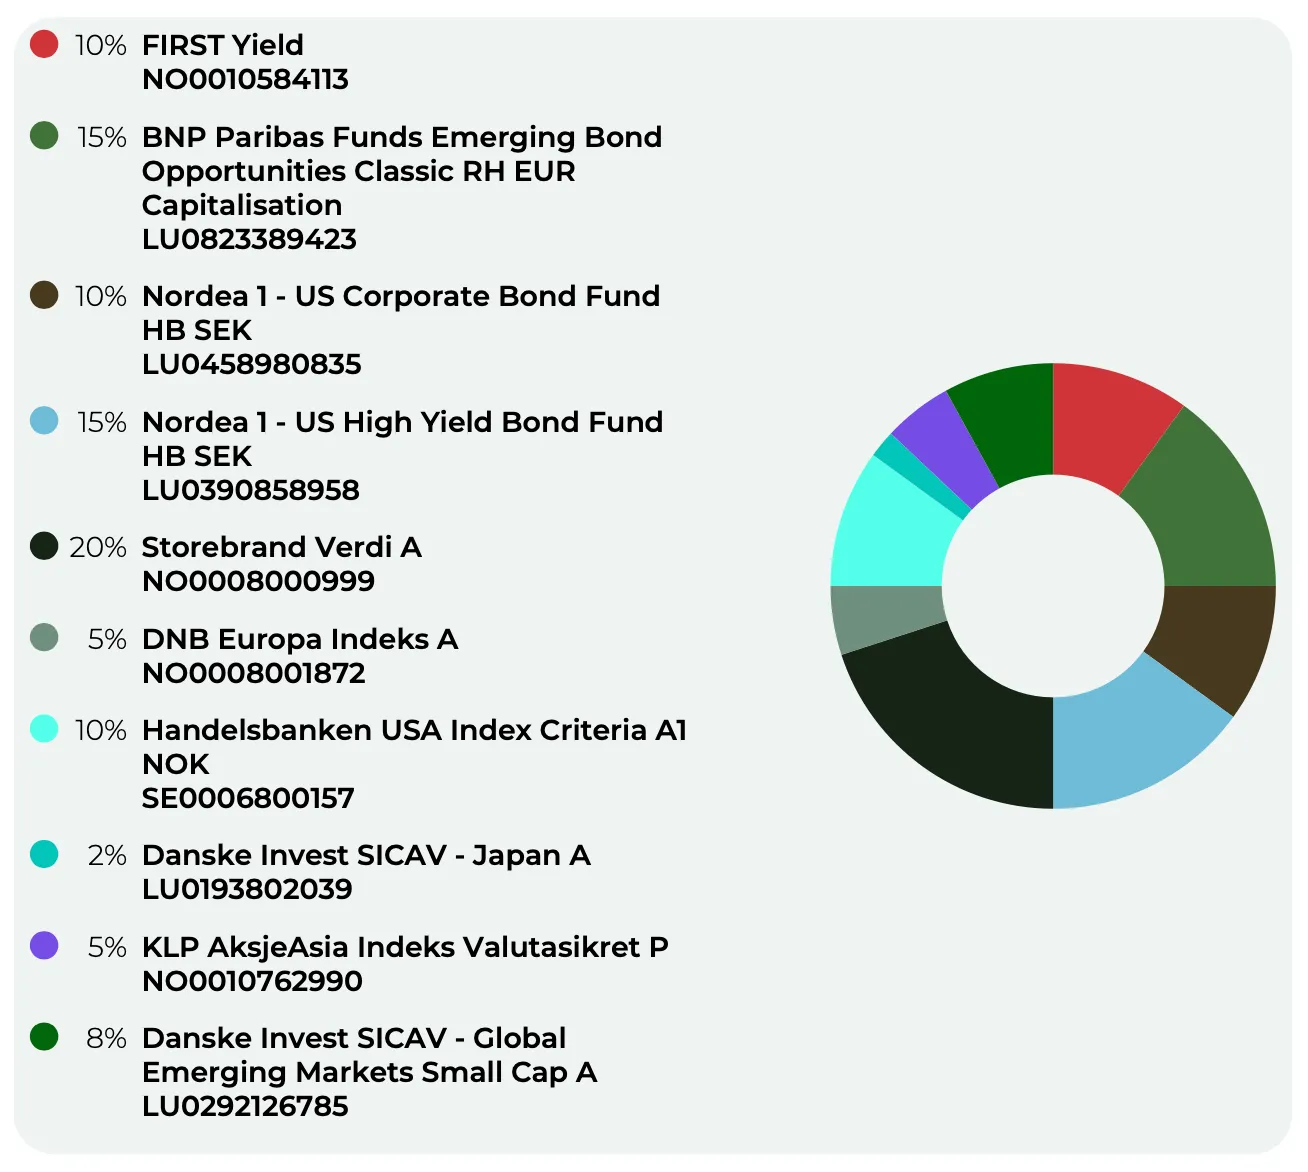
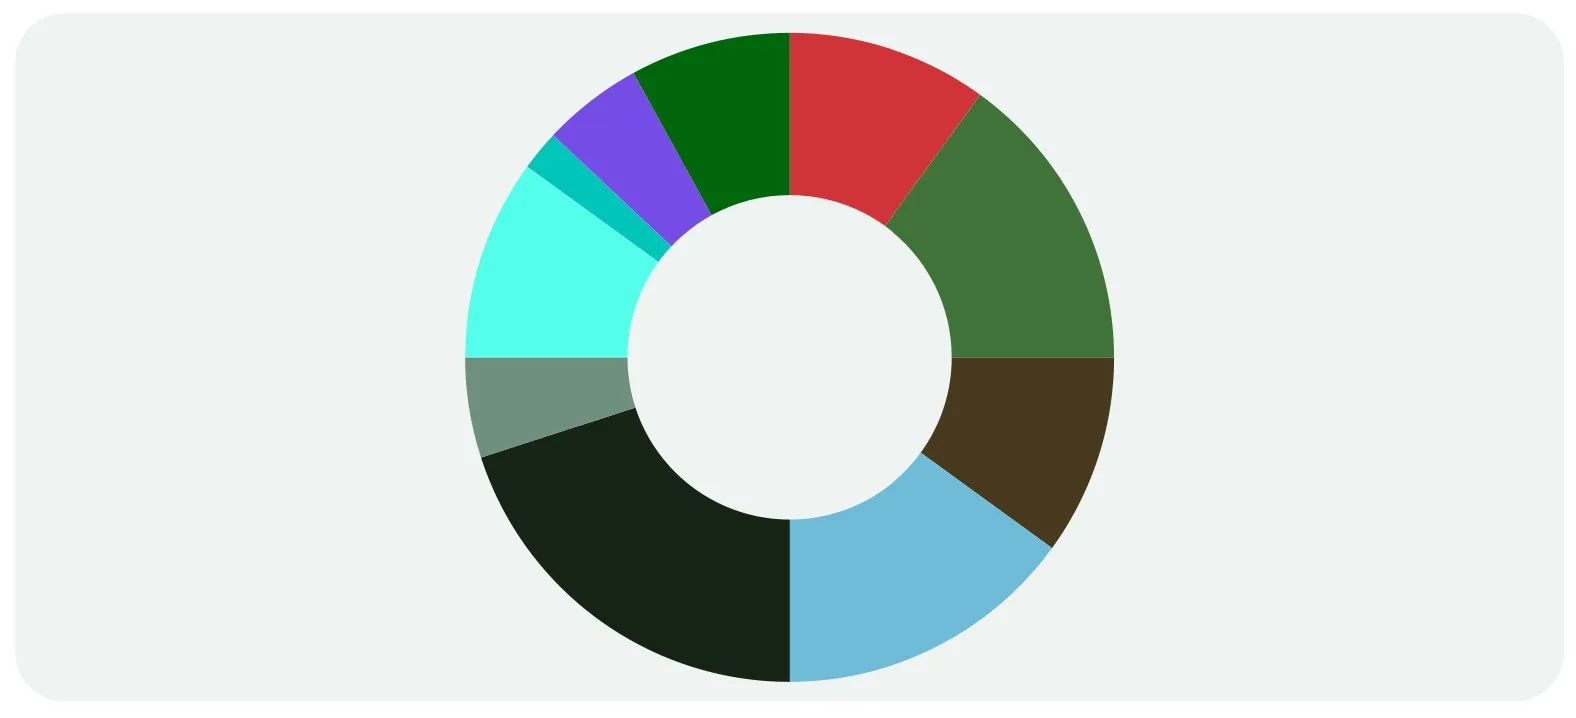
Fund allocation
Visualise the asset allocation on fund level
With legends:
Without legends:
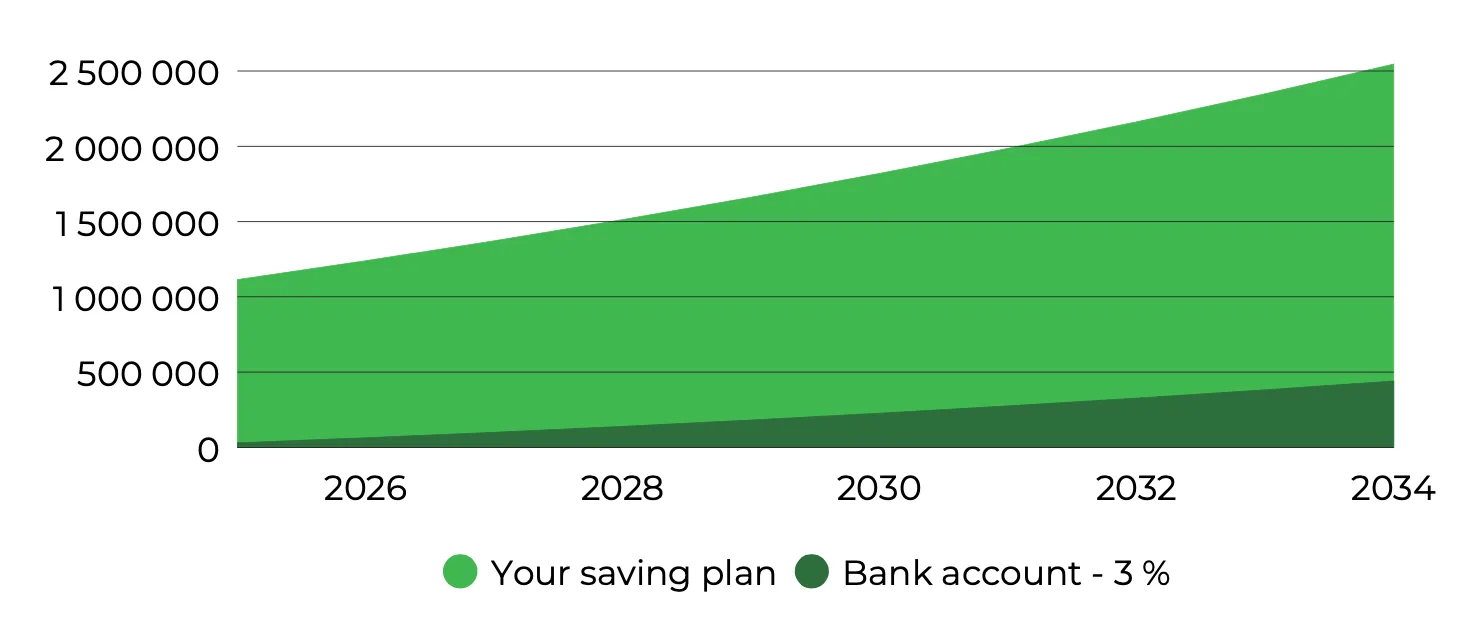
Expected value chart
The expected value chart serves the purpose of presenting the expected value of the portfolio:
Expected path chart
The expected value chart serves the purpose of presenting the expected path of the portfolio:
Picture to be inserted
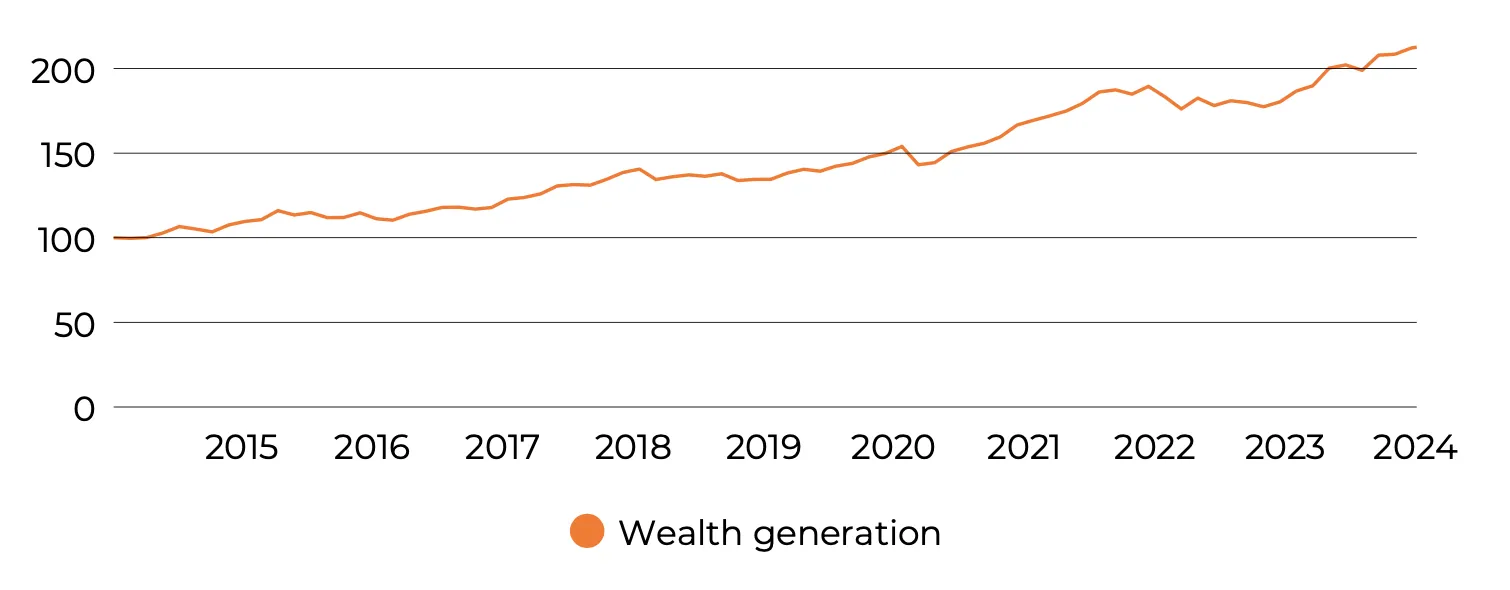
Historical return chart
The historical return chart serves the purpose of presenting the historical return of the portfolio:
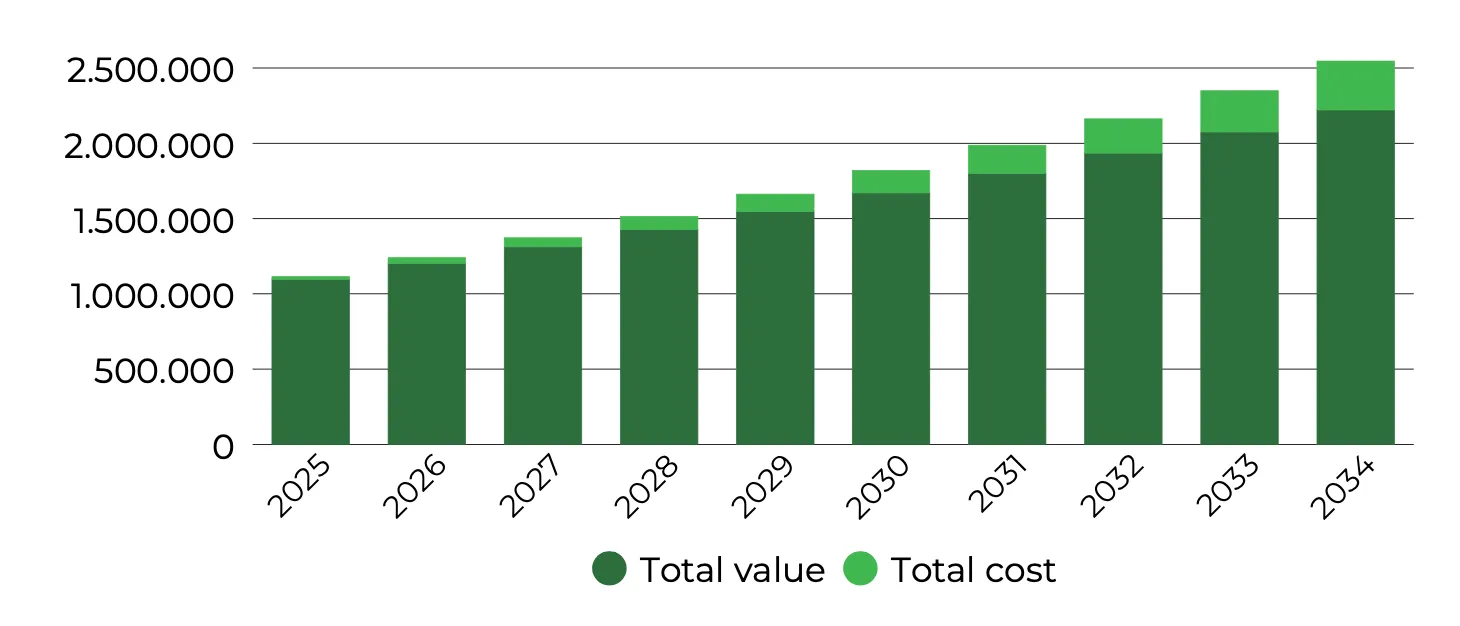
Cost chart
The cost chart serves the purpose of presenting the expected value of the portfolio and the effect of cost over time:
Cashflow chart
The cashflow chart serves the purpose of presenting the expected cashflow of the saving plan and visualize how the withdrawals are met: